 Pivograph
Overview
Pivograph draws an organization as a graph: its projects, platforms, data sources and partners are nodes, and the ways they depend on, feed or maintain each other are edges. The whole map is one JSON document. You can write it by hand, generate it (an AI agent is a good fit), import it from an organization's published Open Contributions Descriptor, then refine it in the browser.
Rendering and interaction come from Pivotick, a graph library by CIRCL. Pivograph adds a document format, forms to edit every node and edge, types, tags, GitHub details, filters, and an embeddable read-only viewer.
- App: ecrou-exact.github.io/project-graph — open the bundled Rulezet example, or your own file.
- Source: github.com/ecrou-exact/project-graph (MIT).
- For AI agents:
llms.txtand the full text of this page asllms-full.txt; the JSON schema; examples.
What a map contains:
| Part | What it holds |
|---|---|
nodes | The things being mapped. Each has an id, a label, and optionally a type, a description, links, a GitHub repository, tags, extra details and its own look. |
edges | Directed connections between two nodes: a label that says how they are related, an arrow direction, a type and a look. |
nodeTypes, edgeTypes | Shared defaults. A node of type project takes the type's colour, shape, image and label style unless it sets its own. |
tags | How each #tag is drawn: colour and icon. Tags appear as small pills under nodes and can filter the graph. |
meta | Title, description and a few document settings. |
Quick start
In the browser. Open the app. It starts with the Rulezet example, locked (it can be explored and exported, not edited). The Graph menu opens a map (or drop a .json file on the page), imports an organization's Open Contributions Descriptor, or starts a new graph from ready-made types. Add creates nodes and edges. Export saves the map as JSON, or as a PDF or Markdown report with a picture of the graph. Changes are also kept in the browser between visits.
From the command line.
git clone https://github.com/ecrou-exact/project-graph.git
cd project-graph
npm install
npm run dev      # http://localhost:5173
npm test         # tests for the document format
npm run build    # static site in dist/
The smallest valid document has one node:
{ "nodes": [{ "id": "rulezet" }] }Everything else is optional. A missing label defaults to the id; missing types, tags and styles fall back to built-in defaults.
Mapping an organization
This section is a procedure. It is written for an AI agent (or a person) asked to "map organization X with Pivograph", and it ends with a document that loads without errors and reads well. Follow the steps in order.
1. Collect the sources
Gather facts before writing anything, and keep the URL of every fact you use.
- The organization's Open Contributions Descriptor, if it publishes one:
https://<domain>/.well-known/open-contributions.json. It lists projects, licenses, repositories, open data, standards and relationships in a structured form. If it exists, load it in the app with Graph → Import an organization… first: it gives you a correct skeleton in one step (see Open Contributions Descriptor). - The code hosting organization:
https://github.com/<org>(or GitLab). List the repositories that are real projects: skip forks, archived experiments and tooling repositories unless they matter to the map. For each project, note the repository description, license, main language and topics. The GitHub API gives them without authentication (https://api.github.com/repos/<owner>/<repo>), at up to 60 requests per hour. - The website and documentation of the organization and of each project: what the project is for, who uses it, which other projects it talks to.
- The code itself, for relationships: API clients, configuration files, import/export modules, webhooks, submodules, dependency manifests. A relationship you can point to in code is worth more than one inferred from a website.
2. Decide what is a node
A node is anything with its own identity that a reader would want to locate on the map:
- the organization itself and the teams or partner organizations that matter;
- software projects, platforms and services (usually the bulk of the map);
- datasets, feeds and published standards;
- important external things the projects depend on or serve (another organization's platform, a data source, a standards body).
Keep the map about one level of granularity: if one node is "MISP", its sub-modules are not separate nodes unless the map is about MISP's internals. When in doubt, a detail belongs in a node's description, details or tags, not in a new node.
3. Decide what is an edge
An edge says how two nodes are related, and its arrow says which way the relationship goes. Use one convention for the whole map and write it in meta.description. The most readable convention is "the arrow goes from the one who acts to the one acted upon": A → B when A calls, uses, imports from, feeds or maintains B.
- Write the relationship as a short verb phrase in
label:uses,pulls rules from,exports events to,queries CVE data from,maintains. - Use
"direction": "both"only for genuinely symmetric relationships (two-way sync), and"none"for associations without a direction (affiliated with). - Explain the mechanism in the edge's
description(which API, which job, which format), and put checkable facts indetails(for example{ "API": "/api/rule/search", "Auth": "API key" }). - An edge from a node to itself is allowed (for example two instances of the same platform federating).
4. Design the types and tags
Types carry the look, so the map stays consistent and the JSON stays short:
- 3 to 8 node types (
project,platform,dataset,organization,standard…), each with a colour, a shape and optionally an image or a bundled icon; - a few edge types for the relationships that repeat (
uses,feeds,develops), each with a colour and a default label and direction; - tags for cross-cutting facts that should be filterable: technology (
python,yara), domain (threat-intelligence), status (archived). GitHub topics make good tags. Keep them lowercase with hyphens.
5. Write the document
Follow the document format exactly. Rules that matter:
- Ids are short, stable and unique: lowercase with hyphens (
misp,vulnerability-lookup). Edges refer to nodes by id. - Every node gets a
labeland, whenever possible, a one-sentencedescriptionwritten for someone who does not know the project. - Put the project's website in
url, the repository ingithub(owner/repo), and other useful pages inlinks. - Leave out anything you would only be guessing. A smaller correct map is better than a complete-looking wrong one.
- Put the sources you used in each node's
details(for example"Source": "https://…") when a fact is not obvious. - Set
meta.title, ameta.descriptionthat states the arrow convention and the date the facts were checked, andmeta.linkDistance(200–350) if nodes are big or edge labels long.
6. Validate
Load the file in the app (Graph → Open a file…, or paste it in the JSON tab and press Apply). The app reports errors (the file is refused: duplicate ids, edges pointing to unknown nodes, wrong top-level shapes) and warnings (the file loads, but something was ignored: an unknown shape or direction, a type that is not declared). Fix every error and every warning. You can also check the file against the JSON schema.
Then read the map as a newcomer would: every node label is understandable, every arrow reads as a sentence (Flowintel → uses → MISP), nothing important floats unconnected.
Checklist
- Every node has
id,label,description; projects havegithuband/orurl. - Every edge has a
labelthat is a verb phrase, and the arrow follows the convention inmeta.description. - Types are declared in
nodeTypes/edgeTypesbefore being used. - Tags are lowercase-with-hyphens and meaningful as filters.
- No duplicate ids; no edge to a missing node; the app shows no warning.
- Facts that are not obvious cite a source in
details.
Prompt template
Give an AI agent this prompt, with the organization filled in:
Map the organization <NAME> (<website>, <code hosting URL>) with Pivograph.
Read https://ecrou-exact.github.io/project-graph/llms-full.txt first and follow
its "Mapping an organization" procedure and "Document format" exactly.
Check https://<domain>/.well-known/open-contributions.json and use it if present.
Map <scope: all active projects / the projects around X / …>.
Arrow convention: from the one who acts to the one acted upon.
Only include relationships you can support with code or documentation, and
cite the source in each edge's details. Output one JSON document, nothing else.
Document format
A Pivograph document is a JSON object. All top-level keys are optional; unknown keys are ignored. The JSON schema describes the same format for validators.
{
  "version": 1,
  "meta": { "title": "…", "description": "…" },
  "nodeTypes": { "project": { … } },
  "edgeTypes": { "uses": { … } },
  "tags": { "open-source": { … } },
  "sections": [ { "title": "…", "x": 0, "y": 0, … } ],
  "arrows": [ { "from": { "node": "…" }, "to": { "section": "…" }, … } ],
  "nodes": [ { "id": "…", … } ],
  "edges": [ { "from": "…", "to": "…", … } ]
}
Inheritance. For every visual field, the value on the node or edge wins; otherwise its type's value is used; otherwise the built-in default. Leaving a field out is how you say "inherit".
meta
| Field | Type | Description |
|---|---|---|
title | string | Shown in the app's header and the browser tab. |
description | string | What the map shows, the arrow convention, when facts were checked. |
linkDistance | number | Edge length in the layout. Default 150; raise it (200–350) for big nodes or long edge labels. |
fixedLayout | boolean | Nodes stay exactly at their x / y: no force layout, as in a drawn diagram. Add → Fixed layout toggles it. |
readOnly | boolean | Opens the map locked: it can be explored and exported, not edited. Set automatically on imported descriptors and on the bundled example. To change a locked map, edit its JSON file. |
source | object | Where the map came from, e.g. { "format": "ocd", "domain": "misp-project.org" }. Set by imports. |
nodes
Each node is an object. Only id is required.
| Field | Type | Description |
|---|---|---|
id | string or number | Required. Unique. Edges refer to it. Use lowercase-with-hyphens. |
label | string | Displayed name. Defaults to the id. |
type | string | A key of nodeTypes. Undeclared types load with a warning. |
description | string | One or two sentences, shown in the details panel, the tooltip and the node list. |
url | string | The node's website. |
graph | string | Another graph that details this node, e.g. examples/circl/misp.json for an organisation and its projects: a Pivograph graph or an OCD file, as a URL or a path relative to the app. The details panel and the right-click menu offer Open its graph; a ← button in the header leads back. |
github | string | GitHub repository: owner/repo, or any github.com URL of the repository (normalized to owner/repo). |
githubInfo | object | Repository summary saved by the app when a repository is fetched in the node form: fullName, url, description, homepage, stars, forks, issues, language, license, topics, archived, pushedAt, fetchedAt. Kept only together with github. You can fill it yourself from the GitHub API. |
links | array | Other links: [{ "label": "Documentation", "url": "https://…" }]. label is optional. |
tags | array or string | ["threat-intelligence", "python"], or "#threat-intelligence #python". Normalized to lowercase, spaces become hyphens, duplicates removed. |
details | object | Extra facts shown in the details panel: strings, numbers, booleans, lists, or nested objects of those. Nested objects are shown as sub-sections. Empty values are dropped. |
x, y | number | Saved position. Both are needed. Export keeps positions unless you untick positions. |
Look (each can also be set on a node type):
| Field | Type | Default | Description |
|---|---|---|---|
color | CSS colour | #4f7cff | Fill colour. transparent works, e.g. for logos. |
shape | string | circle | circle, square, triangle, hexagon, or card: a rounded box with the image and the label inside (see below). |
size | number | 14 | Radius in pixels. |
image | string | URL, path relative to the app (icons/tool.svg, logos/misp.png), or data: URL. | |
imageFit | string | cover | cover (fills the shape), contain (whole image inside), icon (a glyph on the node's colour), frame (square shape framing the image). |
borderColor | CSS colour | #ffffff | Outline colour. |
borderWidth | number | 2 | Outline width; 0 removes it. |
hideLabel | boolean | false | Hide the label, e.g. when the image already shows the name. |
labelColor | CSS colour | Label text colour. | |
labelBackground | CSS colour or "none" | Label background; "none" for no background. | |
labelSize | number | auto | Label font size in pixels. |
labelFont | string | sans, serif, mono, rounded, condensed, or any CSS font-family. | |
hideBadges | boolean | false | Hide the tag pills under the node. |
Card nodes (shape: "card") draw the box of a diagram: the image (if any), then the label and an optional subtitle, inside the box; edges and arrows end on its border. color is the background (default white), borderColor / borderWidth the border, labelColor / labelSize / labelFont the text (\n starts a new line). size and imageFit don't apply.
| Field | Type | Default | Description |
|---|---|---|---|
subtitle | string | Second line, under the image and label. | |
width, height | number | its content | Box size in pixels. |
padding | number | 16 | Space between the border and the content: raise it to give logos more room. |
imageSize | number | 56 | Image height in pixels. |
imagePosition | string | top | top (image above the label) or left (beside it). |
labelFont also accepts hand: Excalidraw's hand-drawn font (Virgil, bundled).
Bundled images: icons/project.svg, platform, tool, data, organization, format, rule, code (white glyphs for imageFit: "icon").
edges
Each edge is an object with from and to.
| Field | Type | Description |
|---|---|---|
from, to | string or number | Required. Node ids. Both nodes must exist. |
id | string | Unique. Defaults to from-to (with a suffix if needed). |
label | string | How the two are related: a short verb phrase shown on the edge. |
type | string | A key of edgeTypes. |
description | string | The mechanism behind the relationship. |
details | object | Extra facts, as for nodes (API endpoints, authentication, sources…). |
Look (each can also be set on an edge type):
| Field | Type | Default | Description |
|---|---|---|---|
direction | string | forward | forward (arrow at to), backward (arrow at from), both, none. |
color | CSS colour | #8a94a6 | Line and arrow colour. |
width | number | 2 | Line width. |
dashed | boolean | false | Dashed line. |
curve | string | auto | auto (straight, curved only between nodes with several edges), straight, curved. |
animated | boolean | false | Moving dashes along the edge, showing the flow. |
hideLabel | boolean | false | Hide the label. |
labelColor, labelBackground, labelSize, labelFont | As for nodes. |
nodeTypes and edgeTypes
Objects keyed by type name. A node type accepts label (display name) and every node look field; an edge type accepts label (the default edge label) and every edge look field.
"nodeTypes": {
  "project": { "label": "Project", "color": "#3b63f3", "shape": "hexagon", "size": 24,
               "image": "icons/project.svg", "imageFit": "icon" },
  "dataset": { "label": "Open data", "color": "#c2860b", "image": "icons/data.svg", "imageFit": "icon" }
},
"edgeTypes": {
  "uses":  { "label": "uses", "color": "#0f9d8a" },
  "feeds": { "label": "feeds", "color": "#c2860b", "animated": true },
  "sync":  { "label": "syncs with", "direction": "both", "dashed": true }
}
tags
Tags are declared on nodes. The top-level tags object only sets how a tag is drawn; tags without an entry get a colour derived from their name.
| Field | Type | Description |
|---|---|---|
color | CSS colour | Pill colour; the text turns black or white for contrast. |
icon | string | A bundled Font Awesome Free icon name. |
"tags": {
  "open-source": { "color": "#2f9e44", "icon": "github" },
  "threat-intelligence": { "color": "#d6384b", "icon": "shield-halved" }
}
Available icons: shield-halved, bug, virus, skull, lock, key, fingerprint, triangle-exclamation, circle-info, circle-question, check, xmark, star, flag, tag, heart, fire, bolt, bell, lightbulb, eye, magnifying-glass, database, server, cloud, network-wired, globe, link, code, terminal, gear, wrench, cube, robot, rocket, chart-line, clock, book, file-lines, graduation-cap, user, users, building, handshake, scale-balanced, money-bill, and the brands github, gitlab, python, js, rust, docker, linux, windows, apple, android, aws, google, slack, discord, mastodon.
sections
Titled frames drawn behind the graph ("Incident response", "Sensors"…), for the picture only: they hold no nodes and edges don't point to them. Add one with Add → Section; drag its title to move it, its bottom-right corner to resize it, double-click its title to edit it (or use the Sections tab). Pair them with meta.fixedLayout so the nodes stay inside. They are part of the PNG export.
| Field | Type | Default | Description |
|---|---|---|---|
x, y | number | Required. Top-left corner, in graph coordinates (the same as the nodes' x / y). | |
width, height | number | 400, 240 | Size. |
title | string | Shown in the top-left corner. | |
color | CSS colour | grey | Title colour, and the line under it. |
underline | boolean | when color is set | Line under the title. |
titleSize | number | 22 | Title font size in pixels. |
titleFont | string | As labelFont. | |
fill | CSS colour or "none" | light grey | Background; "none" for a bare title (e.g. the diagram's heading). |
borderColor | CSS colour or "none" | grey | Border. |
id | string | from the title | Unique. |
"meta": { "title": "SOC stack", "fixedLayout": true },
"sections": [
  { "title": "Incident response", "x": 20, "y": 115, "width": 750, "height": 420, "color": "#1971c2" },
  { "title": "Sensors", "x": 20, "y": 880, "width": 1660, "height": 250 }
]
arrows
Arrows drawn by Pivograph, like sections, for diagrams: unlike an edge, an arrow can start or end on a section or on a free point, and each end can sit anywhere on its target. Add one with Add → Arrow; click it on the graph to select it, then drag its ends (onto a node, a section or empty space) and its label; Delete removes it, a double-click edits it. Arrows are part of the PNG export, not of the report.
| Field | Type | Default | Description |
|---|---|---|---|
from, to | object | Required. { "node": "id" }, { "section": "id" } or { "x": 0, "y": 0 }. Add "at": [u, v] to place the end on the target's box: [0, 0] top-left, [1, 1] bottom-right, [0.5, 1] the middle of the bottom side. Without at, the end sits on the side facing the other end (straight up or down from a section). | |
label | string | \n starts a new line. | |
description | string | Shown when the pointer is over the arrow. | |
direction | string | forward | As for edges: forward, backward, both, none. |
route | string | straight | straight or elbow (right angles). |
color, width, dashed | #343a40, 2, false | Line. | |
labelColor, labelSize, labelFont, labelBackground | line colour, 14 | Label; the background defaults to the page colour, "none" for none. | |
labelOffset | [dx, dy] | [0, 0] | Shift of the label from the middle of the arrow (set by dragging it). |
"arrows": [
  { "from": { "node": "misp", "at": [0.5, 1] }, "to": { "section": "pipeline" },
    "direction": "both", "label": "4) Feed detections\n(IoCs) & sightings", "color": "#1c5cff" }
]
Validation
Loading a document reports:
- Errors — the document is refused: the root is not an object;
nodes,edges,nodeTypes,edgeTypesortagshas the wrong shape; a node has no id; two nodes share an id; an edge lacksfromorto, or points to a node that does not exist. - Warnings — the document loads, the listed value is ignored: an unknown
shapeordirection; atypenot declared innodeTypes/edgeTypes; agithubvalue that is not a repository; a duplicate edge id (renamed).
Examples
examples/rulezet.json: how Rulezet connects to ten other projects, with logos, detailed relationship descriptions, GitHub details and tags. It is the example the app opens with.examples/circl.json: the GitHub organisations managed or co-managed by CIRCL, from new.circl.lu. CIRCL in the centre and 21 organisations around it, each with its logo, description, website, most starred repository (githubInfo) and most used topics as tags. Generated bynode scripts/circl-example.mjsfrom the GitHub API.examples/ngsoti-soc-stack.json: a drawn diagram — the NGSOTI SOC stack (sensors, Tenzir pipeline, MISP, flowintel, AIL) with Rulezet: card nodes, sections, arrows, a fixed layout and the hand-drawn font. It opens read-only (Graph → NGSOTI SOC stack example).examples/minimal.json: the smallest useful map — two types, three nodes, two edges.
A compact example with the main features:
{
  "version": 1,
  "meta": {
    "title": "Projects linked to Rulezet",
    "description": "Arrow = who uses whom. Checked against each project's code, September 2026.",
    "linkDistance": 260
  },
  "nodeTypes": {
    "project": { "label": "Project", "color": "#3b63f3", "shape": "hexagon", "size": 24,
                 "image": "icons/project.svg", "imageFit": "icon" }
  },
  "edgeTypes": {
    "uses": { "label": "uses", "color": "#0f9d8a", "direction": "forward" }
  },
  "tags": { "threat-intelligence": { "color": "#d6384b", "icon": "shield-halved" } },
  "nodes": [
    {
      "id": "rulezet", "label": "Rulezet", "type": "project",
      "description": "Community platform for sharing and managing detection rules.",
      "url": "https://rulezet.org", "github": "rulezet/rulezet-core",
      "tags": ["threat-intelligence", "yara"]
    },
    {
      "id": "vulnerability-lookup", "label": "Vulnerability-Lookup", "type": "project",
      "description": "Vulnerability lookup and correlation.",
      "github": "vulnerability-lookup/vulnerability-lookup",
      "links": [{ "label": "Public instance", "url": "https://vulnerability.circl.lu" }]
    }
  ],
  "edges": [
    {
      "from": "rulezet", "to": "vulnerability-lookup", "type": "uses",
      "label": "fetches CVE & EPSS data",
      "description": "Rulezet uses Vulnerability-Lookup as its CVE reference: every CVE shown on a rule links to its vulnerability.circl.lu page.",
      "details": { "Source": "https://github.com/rulezet/rulezet-core" }
    }
  ]
}
Open Contributions Descriptor
The Open Contributions Descriptor (OCD) is a JSON file in which an organization describes its open source projects, open data, participation in open standards and relationships with other organizations. It is published at https://<domain>/.well-known/open-contributions.json. OCD Viewer shows it as cards and, through Pivograph, as a graph.
Pivograph recognizes an OCD file wherever a JSON file is accepted (Graph → Open a file…, drag and drop, the JSON tab, Graph → Import an organization…, ?src=, postMessage) and turns it into a map:
| OCD | Map |
|---|---|
organization | The central Organization node. Its fields (domain, country, links…), the document's contacts, policies, spec_version, generated_at, extensions and any unknown top-level section go to the node's details. |
projects[] | One Project node each, linked from the organization (edge type maintains, no label). name → label, description → description, tags → tags, repository.url → github when it is a GitHub repository. Everything else (status, repository, links, participate, governance, release, custom fields) is kept as-is in details, in its original order. status: archived / disabled also becomes a tag. |
open_data[] | Open data nodes (edge publishes); fields in details. |
open_standards[] | Open standard nodes, one per body (edge participates in, labelled with the contribution types); fields in details. |
relationships[] | External organization or External project nodes, one per target, linked from the organization with the relationship type as label: maintains, co-maintains (both ways), supports, contributes to, sponsors, upstream (arrow towards the organization), downstream, member of, affiliated with. since, until, evidence, contacts and tags go to the edge's details. |
Because each item keeps its OCD structure in details, the details panel reads section by section like OCD Viewer, and nothing is lost — unknown or future fields included.
An imported descriptor opens read-only: no creation, editing or deletion (Pivotick's Create tools, context-menu entries, double-click, the app's buttons and the JSON editor are off). Browsing, filtering and exporting still work. The lock can't be lifted in the app: the graph stays a faithful view of the descriptor. To build your own map around it, start a New graph, or export the JSON and edit it.
Graph → Import an organization… accepts a local file, a domain (misp-project.org becomes https://misp-project.org/.well-known/open-contributions.json), or a URL, and offers the official samples (MISP, AIL, flowintel). A remote file must be served with CORS headers; otherwise download it and open it.
To go further than the descriptor, enable editing and add what it does not say: relationships between the organization's own projects, logos, tags with colours and icons.
Embedding
Pivograph can be shown inside another site with an <iframe>, without its top bar, displaying a map you choose.
| URL parameter | Effect |
|---|---|
embed=1 | Hides the top bar (logo and menus). Starts empty and read-only. Never reads or overwrites the visitor's saved map. |
src=<url> | Loads this JSON at start: a Pivograph document or an OCD file. The server must allow CORS. |
example=<name> | Opens a bundled example: rulezet, circl or ngsoti, e.g. ?example=ngsoti. Works without embed too: the address follows the example shown, so it can be shared. |
sidebar=0 | Hides the side panel. |
mode=viewer | Only the graph: pan, zoom and drag, no panels (Pivotick's viewer mode). Pair with sidebar=0. |
theme=light / theme=dark | Follow the host page's theme instead of the visitor's system setting. |
bg=<colour> | Background of the page and the graph (#rrggbb or rgb(…)), e.g. the host page's own background. |
toolbar=1 | With embed=1: keeps the top bar (Graph and Add menus), for a host page that lets its users edit the map (see pivograph:changed below). |
tags=1 | Starts with the tag pills shown on the graph. They are hidden by default; the # Tags button shows them. |
The map below is the app embedded in this page, loading the example with ?embed=1&sidebar=0&src=…:
<iframe
  src="https://ecrou-exact.github.io/project-graph/?embed=1&src=https://example.org/.well-known/open-contributions.json"
  title="Map of our projects"
  style="width: 100%; height: 80vh; border: 0"
  allow="fullscreen"></iframe>
The host page can also send the data itself, which works for files that have no URL (for example a file the visitor opened):
const frame = document.querySelector('iframe')

window.addEventListener('message', (event) => {
  if (event.source !== frame.contentWindow) return
  if (event.data?.type === 'pivograph:ready') {
    frame.contentWindow.postMessage(
      { type: 'pivograph:load', data: documentOrOcd, name: 'open-contributions.json' },
      'https://ecrou-exact.github.io',
    )
  }
})| Message | Direction | Meaning |
|---|---|---|
{ type: 'pivograph:ready' } | app → host | The app is ready to receive data. Sent once at start. |
{ type: 'pivograph:load', data, name } | host → app | Load data (a Pivograph document or an OCD file). Only the embedding page can send it. |
{ type: 'pivograph:loaded', nodes, edges } | app → host | Loaded, with the number of nodes and edges. |
{ type: 'pivograph:error', message } | app → host | The data was refused; message says why. |
{ type: 'pivograph:changed', data } | app → host | An editable map (loaded with meta.readOnly: false) was changed; data is the whole document, positions included. Never sent for read-only maps. |
{ type: 'pivograph:get' } | host → app | Ask for the current document. |
{ type: 'pivograph:snapshot' } | host → app | Ask for a PNG of the graph as drawn. |
{ type: 'pivograph:snapshot', image } | app → host | The answer: a data:image/png URL, or null when the picture could not be made. |
{ type: 'pivograph:export', format } | host → app | Run one of the app's exports in the frame: json, pivotick, png, md or pdf (the report). |
{ type: 'pivograph:theme', scheme, background } | host → app | Switch to light / dark and/or a background colour, live (when the host page changes theme). |
{ type: 'pivograph:document', data } | app → host | The answer: the whole document, positions included. |
OCD Viewer uses this for its Graph view.
Hugo
A site built with Hugo can show a graph with the Pivograph component (hugo/pivograph in the repository). Hugo builds the graph's JSON itself, from the site's pages or from a data file, and every graph works with and without JavaScript:
| Without JavaScript | With JavaScript | |
|---|---|---|
| Picture | The graph drawn by Hugo as SVG at build time: nodes with their shape, colour, logo and label; edges with their colour, dashes, arrows and labels. A node is a link to the page of its own graph (graph.graph), else to its entry in the text, and shows its name on hover. | The interactive graph (the Pivograph app in an iframe) replaces the picture: zoom, drag, search, filters by tag, type and relationship, details panel. If the app can't load, the picture comes back. |
| Text | The graph written out: every node with its links, GitHub facts, tags and details, and every relationship as a sentence (report protocol). Read by search engines and screen readers. | The same text, folded under Read the graph as text. |
| Data | /pivograph/<name>.json, linked under the graph. | The same file, handed to the app. |
The same page of the example site, both ways:
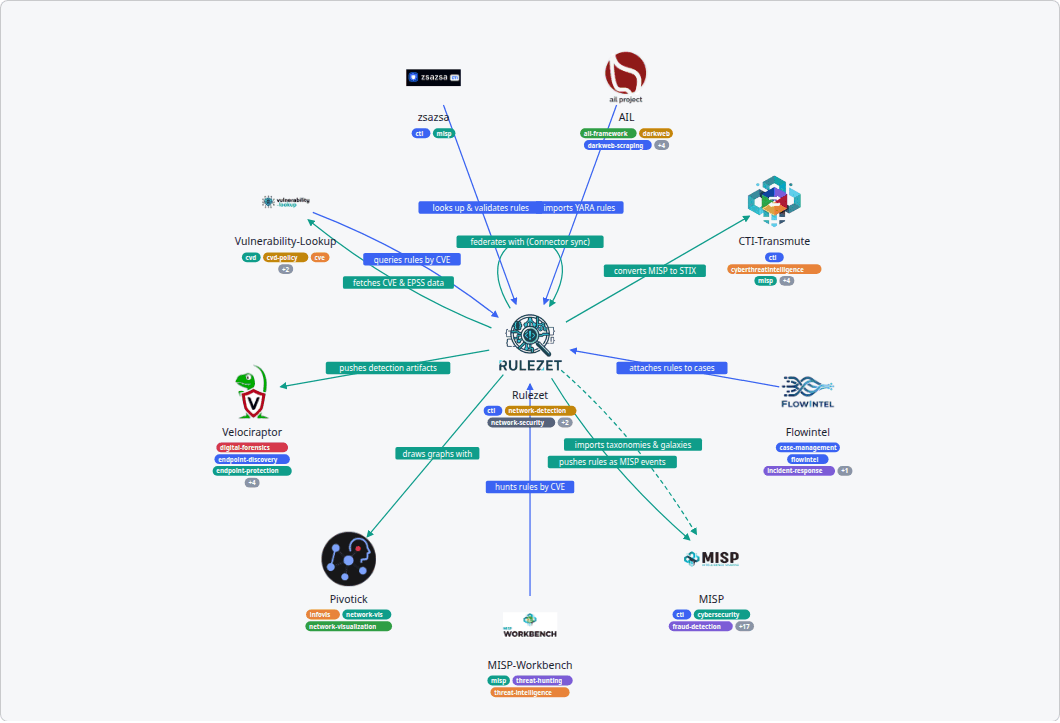
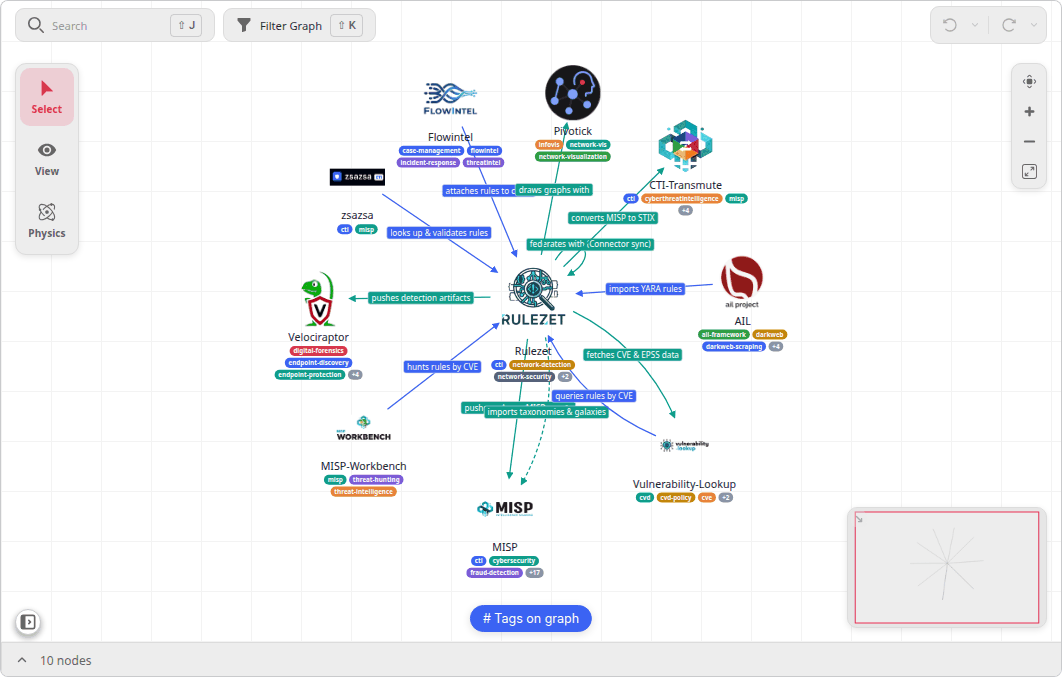
The example's source: hugo/example.
hugo/example/
  hugo.toml                     theme = "pivograph" (a real site: ["my-theme", "pivograph"])
  content/
    projects/
      _index.md                 graph: title, nodeTypes, edgeTypes · {{< pivograph >}}
      rulezet/
        index.md                graph: type, url, github, image, relations
        logo.png
      misp/
        index.md
        logo.png
      …                         one bundle per project
    circl/
      _index.md                 the CIRCL GitHub organisations · {{< pivograph >}}
      circl/  misp/  …          one bundle per organisation, with its logo and GitHub facts
hugo then writes public/pivograph/projects.json and public/pivograph/circl.json, the documents the pages show. Both sections are generated from the app's examples by node scripts/hugo-example.mjs.
Add it to a Hugo site
Copy the component into the site's
themes/folder:bashgit clone --depth 1 https://github.com/ecrou-exact/project-graph /tmp/project-graph cp -r /tmp/project-graph/hugo/pivograph themes/pivographOr as a Hugo Module:
[[module.imports]] path = "github.com/ecrou-exact/project-graph/hugo/pivograph"(needs Go).Enable it in
hugo.toml, after the site's theme. A singletheme = "x"becomes a list:tomltheme = ["my-theme", "pivograph"]The component adds a shortcode and partials under
pivograph/; it doesn't change any existing page, layout or style.Give it data: the site's pages (option A) or a data file (option B).
Place the graph with the shortcode in a Markdown page, or with the partial in a layout:
text{{< pivograph >}}go-html-template{{ partial "pivograph/embed.html" (dict "page" . "section" "/projects") }}Check: run
hugo. It must print noWARNfrom pivograph. Then open the page: with JavaScript you get the interactive graph; click Without JavaScript in the switch above the graph (it adds?pivograph=staticto the address), or turn JavaScript off, to see the version without JavaScript, the picture drawn by Hugo and the text; Interactive brings the graph back. That choice holds for the browser tab, and the site's links keep it, until?pivograph=interactive.
Requirements: Hugo 0.130 or later, standard or extended edition. Nothing to install with npm, no build step besides Hugo.
A graph from the site's pages
Use this when the site already has one page per project, team, product… Every page below the section whose front matter has a graph map becomes a node; its relations are its outgoing edges.
# content/projects/rulezet/index.md   (a page bundle: logo.png sits next to it)
---
title: Rulezet                        # the node's label
description: Community platform for sharing and managing detection rules.
tags: [cti, yara]                     # the node's tags (the site's own taxonomy)
graph:
  type: project
  url: https://rulezet.org
  github: rulezet/rulezet-core
  image: logo.png
  relations:
    - to: misp                        # id of another node: its file or bundle name
      label: pushes rules as MISP events
      type: uses
      description: Admins register MISP servers in Rulezet…
    - to: vulnerability-lookup
      label: fetches CVE data from
---
The section's _index.md holds the graph's title and its types, and places it:
# content/projects/_index.md
---
title: Projects linked to Rulezet
description: How Rulezet connects to the other projects of its ecosystem.
graph:
  nodeTypes:
    project: { label: Project, shape: circle, size: 44, imageFit: contain }
  edgeTypes:
    uses: { label: uses, color: "#0f9d8a" }
---

{{< pivograph >}}
Front matter reference
| Where | Key | Becomes | Default |
|---|---|---|---|
| node page | title | node label | |
| node page | description | node description | |
| node page | tags | node tags | |
| node page | graph.id | node id | the file name (misp.md) or bundle name (misp/index.md) |
| node page | graph.label, graph.description, graph.tags | override the three above | |
| node page | graph.image | node image: a page resource (logo.png), a site path (/images/x.png), a URL, or an icon of the app (icons/tool.svg) | |
| node page | graph.graph | node graph: the path of the page that shows this node's own graph (/circl/misp), written as that page's address. Without JavaScript the node links to that page; with JavaScript, Open its graph in the app goes there. The CIRCL example uses it: each organisation's page shows its projects with {{< pivograph data="circl-<id>" >}}. | |
| node page | graph.x, graph.y | the node's position, used by the app and by the picture | computed |
| node page | graph.<field> | any other node field: type, url, github, links, details, color, shape, size, imageFit, githubInfo… | |
| node page | graph.relations[] | edges from this node: to (required) and any edge field: label, type, direction, description, details, color, dashed… | |
section _index.md | title, description | meta.title, meta.description | |
section _index.md | graph.nodeTypes, graph.edgeTypes, graph.tags, graph.linkDistance, graph.meta | the same document keys |
Rules the component applies:
- Every node gets a Site page link back to its page.
- A relation to an id that no page has is dropped, with a build warning naming the page (
pivograph: content/projects/x.md: relation to "y" ignored), so the app never refuses the file. - Graphs shown on a site open read-only.
- Hugo lowercases front-matter keys; the component restores Pivograph's names (
imagefit→imageFit). Hugo also sorts map keys, sodetailscome out in alphabetical order. - Node order is the section's page order (weight, date, then title).
A graph from a data file
Use this for a graph made in the app. Export → Graph data (JSON) in Pivograph, save the file as data/pivograph/<name>.json (or write it as .yaml / .toml), and show it anywhere:
{{< pivograph data="ecosystem" >}}Export with positions ticked (JSON tab) and the picture drawn without JavaScript keeps the app's layout. Without positions, Hugo lays the graph out itself: the most connected node in the centre when it links to at least half of the others, the rest on rings around it.
Parameters
The shortcode and the partial take the same parameters.
| Parameter | Default | Effect |
|---|---|---|
section | the current section | Build the graph from another section: section="/projects". |
data | Use data/pivograph/<name>.* instead of pages. | |
app | params.pivograph.app, else https://ecrou-exact.github.io/project-graph/ | The Pivograph app that draws the interactive graph. |
height | 85vh | Height of the interactive graph. The graph takes the width of its container: give it the whole width of the page for big graphs (the example site keeps only its text in a narrow column). |
sidebar | false | Show the app's side panel (node list, tags, types). |
tags | false | true shows the tag pills, on the interactive graph and in the picture drawn by Hugo. |
relations | false | true writes the relationships as sentences in the text, under each node and in a Relationships section. By default the text only counts them. |
picture | true | false leaves out the picture drawn by Hugo. |
image | A picture of your own (e.g. Export → Picture in the app) shown instead of Hugo's. | |
level | 3 | Heading level of the text's sections. |
text | true | false leaves the text out. Not recommended: without JavaScript, only the picture would remain. |
Site-wide setting, in hugo.toml:
[params.pivograph]
  app = "https://ecrou-exact.github.io/project-graph/"
To host everything yourself, copy the app's build (npm run build, the dist/ folder) into static/pivograph/ and set app = "/pivograph/".
To use the data in your own templates: {{ $doc := partial "pivograph/document.html" (dict "page" . "section" "/projects") }}, then $doc.nodes, $doc.edges… The picture alone: {{ partial "pivograph/svg.html" (dict "doc" $doc) | safeHTML }}.
How it works
- Build time (Hugo, no JavaScript).
document.htmlreads the pages or the data file and returns the document;embed.htmlpublishes it as/pivograph/<name>.jsonwithresources.FromString, then writes the picture (svg.html, laid out bylayout.html), the text (text.html, sentences bysentence.html) and a caption with a link to the data. - In the browser (JavaScript). Unless the address has
?pivograph=static, the script (assets/pivograph/pivograph.js) hides the picture, folds the text, opens the app in an iframe, fetches the JSON from the site itself, embeds the site's images in it as data URLs, and hands it over with thepivograph:loadmessage. The app never loads anything from the site, so no CORS setup is needed, anhttpsapp works with anhttpsite, and the app's picture and PDF exports keep the logos.
Checklist
-
hugobuilds with noWARNorERRORfrom pivograph. -
/pivograph/<name>.jsonloads in the Pivograph app (Graph → Open a file…) with no error or warning. - Without JavaScript (open the page with
?pivograph=static, or turn JavaScript off: in Firefox, F12 → F1 → Disable JavaScript; in Chrome, F12 → Ctrl+Shift+P → Disable JavaScript): the picture shows every node and arrow, and the text lists every node and relationship. - With JavaScript on: the interactive graph shows, with its logos, and Read the graph as text opens the text.
- Every relationship reads well as a sentence in the text (see how a relationship becomes a sentence); reword labels that don't.
Prompt for an AI agent
Add a Pivograph graph to this Hugo site, following
https://ecrou-exact.github.io/project-graph/docs/guide.html#hugo exactly.

1. Copy hugo/pivograph from https://github.com/ecrou-exact/project-graph into
   themes/pivograph and add "pivograph" after the current theme in hugo.toml.
2. For every page of <section> that describes <what the nodes are>, add a
   `graph` map to its front matter: type, url, github, image when known, and
   `relations` to the other pages (to: <file or bundle name>, label: a
   lowercase verb phrase from this page's point of view).
3. In <section>/_index.md, declare nodeTypes and edgeTypes under `graph`
   and put {{< pivograph >}} where the graph should appear.
4. Run `hugo`: fix every "pivograph:" warning. Check that the page works with
   JavaScript on (interactive graph) and off (SVG picture and text).
Do not change the site's theme, layouts or other pages.
Troubleshooting
| Symptom | Cause and fix |
|---|---|
| I can't see the picture drawn by Hugo | With JavaScript on, the interactive graph replaces it. Open the page with ?pivograph=static, or turn JavaScript off, to see it. |
can't evaluate field Pi, math.Sin not defined | Hugo is older than 0.130. Update Hugo (distribution packages are often older; use a release). |
pivograph: … relation to "x" ignored | No page has the graph id x. Use the target's file or bundle name, or set graph.id on it. |
| The interactive graph stays empty | The page's Content Security Policy blocks the iframe or the fetch: allow the app's origin in frame-src, and connect-src 'self', img-src 'self' data:. |
| Logos missing in the picture | graph.image must be a page resource (next to index.md), a path under static/ starting with /, or a full URL. |
| The picture is crowded | Lay the graph out in the app, export it with positions, and use it as a data file (or copy the x, y into graph). |
Reports
Export offers five formats:
| Menu entry | File | Content |
|---|---|---|
| Graph data (JSON) | <title>.json | The document, to open again or edit later. |
| Pivotick data (JSON) | <title>.pivotick.json | The graph for Pivotick alone, without Pivograph: nodes and edges with their computed styles, positions and embedded images, plus the options they need. |
| Report (PDF) | via the print dialog | A picture of the graph, then a text written from every field. Choose Save as PDF. |
| Report (Markdown) | <title>.md | The same report as Markdown, with the picture embedded. |
| Picture (PNG) | <title>.png | The whole graph as drawn, whatever the zoom. |
Pivotick data. The file is self-contained and loads in any page that has Pivotick:
const file = await (await fetch('map.pivotick.json')).json()
new Pivotick(container, file, file.options)nodesandedgesare Pivotick's raw nodes and edges ({ id, data, style },{ id, from, to, data, style }), withxandywhen positions are kept.- Logos and icons are embedded as data URLs, so the file shows them anywhere. An image from another site that doesn't allow cross-origin requests stays a link, and the app says so.
optionsholds the arrow markers (pg-arrow,pg-arrow-start) and the link distance. Without them, Pivotick draws the edges without arrow heads.- An edge label inherited from the edge type is copied into
data.label, the field Pivotick's default label renderer reads.
The file keeps everything Pivotick draws: colours, shapes, sizes, images, borders, line styles, arrows, edge labels. It does not keep what Pivograph draws on top of Pivotick: the tag pills, and the colour, background and font of node and edge labels. Pivotick shows those labels in its default style.
The picture
The graph is drawn as it looks in the app, with images, labels and tag pills included. The picture covers the whole graph, not just the visible part, at twice the screen resolution, and is at most 4000 pixels on its longest side. Images from another site are left out unless that site allows cross-origin requests.
The report protocol
The content is decided by reportModel() in src/report.js, and laid out by buildReport() (Markdown) and reportHtml() in src/reportPrint.js (PDF). The rules are fixed, so any graph gives a complete report and the same document always gives the same text:
- Title from
meta.title(default Untitled graph), then the picture, thenmeta.description. - Overview. The number of nodes, by type; the number of relationships, by edge type when there are several; the three most connected nodes (two relationships or more); the nodes without any relationship; the most used tags.
- Nodes, grouped by type in their order of first appearance, with untyped nodes last under Other. For each node:
- "Label is a type." followed by its description;
- website, GitHub repository (with the saved
githubInfo: description, stars, forks, open issues, language, licence, last update, topics not already in the tags, and the date of the data), other links, tags; detailsas a nested list, with keys shown with_replaced by spaces and URLs as links;- every relationship of the node, as a sentence.
- Relationships, grouped by edge type. A relationship that has a description or details gets its own entry with them. The others are merged when only their object differs: "MISP Project maintains MISP, PyMISP and misp-modules."
- Tags: every tag, with its nodes.
- A footer with the date and the counts.
How a relationship becomes a sentence. The subject is the node the arrow starts from. With direction set to forward (the default) or none, that is the source (from); with backward, it is the target. The label is the edge's own label, else its type's label, else its type id with _ and - turned into spaces. A final parenthesis in the label is moved to the end of the sentence. The label is then read by its words:
| Label | Kind | Sentence |
|---|---|---|
uses, depends on, draws graphs with | verb, alone or ending with a preposition | A uses B. |
pushes rules as MISP events | verb with its own object | A pushes rules as MISP events (→ B). |
member of, affiliated with, used by | state (ends with a preposition, or starts with a participle) | A is member of B. |
API, upstream | noun | A is linked to B (API). |
| none | — | A is linked to B. |
A word counts as a verb when it ends in s (uses, pushes), or when it is one of is, are, was, has, have, can, will, may, must, does, use. Verbs joined by or / and read as one verb (manages or co-manages: A manages or co-manages B). A label that starts with a capital letter is read as a noun. With direction: "both", the sentence ends with "in both directions". An edge from a node to itself reads "… itself".
Writing labels that read well. Use a lowercase verb phrase from the source's point of view: uses, depends on, fetches data from, is funded by. The same label then reads well on the graph and in the report.
The PDF layout
The PDF and the Markdown file say the same thing; the PDF lays it out with the graph's own colours:
- the first page: title, description, a legend of the node types (colour and count) and relationship types (a sample of their line), the picture, and the overview;
- each node with a bar in its colour, its logo or icon, its type, its links, its GitHub statistics, its tags as coloured pills with their icons, its details as a table, and its relationships;
- each relationship type with a sample of its line, colour and dashes included;
- the tag index as pills, and a running header with the title and the date on every page.
The page has no margin of its own, so the browser prints no header or footer (address, date) over the report. Use Save as PDF with the default options; keep Background graphics on if the browser offers it.
From the command line
npm run report -- examples/rulezet.json report.md
npm run report -- open-contributions.json report.md --image graph.png
The command runs the same protocol on a Pivograph document or an Open Contributions Descriptor. Making the picture needs a browser, so the command can only link one you pass with --image.
Using the app
Top bar. Search the docs finds a section of this guide as you type (↑ ↓ and Enter to open it). Add creates a node or an edge. Graph starts a new graph, opens a file (a Pivograph document or an Open Contributions Descriptor), imports an organization from its domain, or loads the Rulezet example. Export saves the graph (see Reports).
Side panel (left, resizable by dragging its edge):
- Nodes and Edges list everything with its type and description. Click to select on the graph, double-click to edit. On a read-only map, double-clicking a node (in the list or on the graph) opens its website in a new tab instead. The filter box searches labels, types, descriptions and tags.
- Tags and Types list tags and types. Click one to filter the graph by it (click again to remove; several combine). Double-click to edit its colour, icon or style.
- JSON shows the document; edit it and press Apply.
Editing a node (double-click, right-click → Edit node, or the Create tools on the canvas) opens a form in tabs:
| Tab | Fields |
|---|---|
| Content | Label, id, type, description |
| Links | Website, GitHub repository, other links |
| Details | Extra fields, edited by path (repository.url) |
| Appearance | Colour, shape, size, image, image fit |
| Border | Width (0 = none), colour |
| Label | Shown or hidden, size, font, text colour, background |
| Badges | Tags (existing tags are suggested), show or hide the tag pills |
Editing an edge (double-click, or right-click → Edit Edge) opens a form with a live preview: Content (source, target, swap, how they are related, type, arrow direction), Line (colour, width, solid or dashed, shape, moving dashes), Label and Details. Drawing a new edge on the canvas (Create → Add edge, then click the source and the target) opens the same form.
GitHub details. Entering a repository in a node's Links tab fetches its description, stars, forks, open issues, language, licence, topics and last update from the GitHub API, and saves them with the node (githubInfo). Refresh from GitHub fetches them again; Also add the repository topics as tags copies the topics into the node's tags. Nothing else calls the API: showing or importing a map never does, which keeps within the limit of 60 unauthenticated requests per hour.
Filtering. Pivotick's Filter Graph panel filters by tags (every tag is offered), type, label, description and, for OCD projects, status and license; relationship types can be switched on and off. Filters set from the side panel and from Filter Graph are the same; active filters are listed at the top of the side panel with Clear.
View. Tags on graph shows or hides every tag pill. Pivotick's View and Physics tools change the layout; the minimap and zoom controls sit on the right.
Saving. A map you create is kept automatically in your browser only (local storage): nothing is sent to GitHub or to any server, and other visitors never see it. The Rulezet example and imported descriptors are locked: they can be explored and exported, not edited. Export → Graph data (JSON) downloads it (with positions, unless positions is unticked in the JSON tab). The other Export entries are described in Reports.
Architecture
Pivograph is a static web app built with Vite, in plain JavaScript modules, with no server.
src/
  main.js        app shell: state, header menus, side panel, import/export, embedding, autosave
  graph.js       GraphView: the Pivotick instance, styles, forms wired to Pivotick's tools, filters, tag pills
  model.js       the document format: parsing and validation, type inheritance, Pivotick styles
  ocd.js         Open Contributions Descriptor → document
  icons.js       node icons drawn on the node's colour
  badgeIcons.js  the bundled Font Awesome Free icons
  github.js      GitHub API client (cached, only used by the node form)
  report.js      the report protocol: document → English Markdown (pure, also used by scripts/report.mjs)
  reportPrint.js the report laid out for print (PDF)
  snapshot.js    the graph as a PNG picture
  ui/            forms, modals, tag pills, GitHub card, details rendering, DOM helper
examples/        example maps
hugo/            the Hugo component (pivograph/: shortcode, partials that build the JSON,
                 draw the SVG and write the text; script) and its example site (example/)
schema/          JSON schema of the format
docs/            this documentation (Markdown, built into docs/index.html and llms-full.txt)
tests/           Vitest tests
Data flow. A JSON file goes through parseDocument() (model.js), which validates it and returns a normalized document with errors and warnings. GraphView.load() turns its nodes and edges into Pivotick elements (toRawNode, toRawEdge); from then on Pivotick holds the nodes and edges, and the app holds the document-level state (meta, nodeTypes, edgeTypes, tags). view.toDocument() reads them back for export and autosave.
Styles are derived, never stored. Every visual field lives in a node's or edge's data. nodeStyle() and edgeStyle() compute the Pivotick style from the data and the types, so an edit made anywhere — a form, Pivotick's own tools, a type change — restyles the element.
Edits from the app's forms go through GraphView.updateNode() / updateEdge() (Pivotick's updateData()). Pivotick's own create and edit tools are routed to the same forms through its callbacks (onBeforeNodeCreate, onBeforeEdgeCreate, onNodeEdit, onEdgeEdit).
Things drawn outside Pivotick's styles:
- Node label looks (colour, background, size, font) go into a generated stylesheet keyed by each node's DOM id.
- Tag pills are SVG groups added inside each node's group, redrawn by a
MutationObserverwhenever Pivotick redraws the node. - Icons with
imageFit: "icon"are redrawn as data URLs on the node's colour, so they stay visible in Pivotick's tooltip and panels.
Pivotick 2.0.1 notes, worked around in the code:
- The constructor is
new Pivotick(container, data, options). getNodes()returns copies with fresh DOM ids;getMutableNodes()returns the live nodes.setStyle()does not redraw a node's content;updateData()does.- With a custom
onNodeEditbody, the Edit Node button of Pivotick's modal fails; the app closes that modal and opens its own form. - Custom edge labels are measured in screen pixels; CSS re-centres them.
Development
npm run dev              # dev server with hot reload: the app, the docs at /docs/, the Hugo example at /hugo-example/ (needs hugo)
npm test                 # Vitest: document format, OCD import, icons, reports, and the Hugo component when hugo is installed (or HUGO=/path/to/hugo)
npm run report -- map.json report.md   # the text report from the command line
npm run hugo:example     # the Hugo example site (needs hugo)
npm run build            # static site in dist/: the app, docs/, llms.txt, llms-full.txt, hugo-example/ (needs hugo)
npm run update:pivotick  # install the latest Pivotick
Every push to main installs Hugo, runs the tests, builds the app, the documentation and the Hugo example site (published at /hugo-example/), and deploys to GitHub Pages. A weekly workflow installs the latest Pivotick, runs the tests and the build, and opens a pull request if the version changed.
This documentation is written in docs/content/*.md. The build also writes docs/search.json, one entry per section, which the search box (docs/search.js, on the docs pages and in the app's top bar; / focuses it in the docs) searches in the browser.
The build turns the Markdown into docs/index.html (static HTML, readable without JavaScript) and llms-full.txt, and publishes the schema and the examples next to it.
For AI agents
| File | Content |
|---|---|
/llms.txt | Short index of this documentation, in the llms.txt format. |
/llms-full.txt | This whole page as Markdown. Read it before generating a map. |
pivograph.schema.json | JSON schema of the document format. |
examples/rulezet.json | A complete, checked map. |
examples/circl.json | An organisation and the 21 GitHub organisations it manages, with logos and GitHub facts. |
examples/ngsoti-soc-stack.json | A drawn diagram: the NGSOTI SOC stack with Rulezet, in card nodes, sections and arrows, with a fixed layout. |
examples/minimal.json | The smallest useful map. |
| Hugo | To add a graph to a Hugo site: procedure, front-matter reference, checklist and prompt. |
To produce a map, follow Mapping an organization, write the document per Document format, and check it against the validation rules. Output only the JSON document.